Your feedback grouped by topic
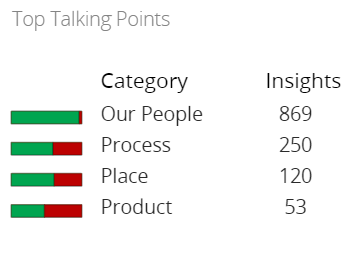
You can see the topics your customers feel most strongly about using the Top talking points gadget. It shows the total number of positive and negative customer responses in each category.
-
The categories default to People, Product, Place, and Process, but these may be different at your organization.
-
Hover over a positive (green) segment to see exactly how many positive responses you received in that category, or a negative (red) segment to see how many negative responses you received.
-
Right-click any segment to apply more specific filters to the widget and Dashboard—for example, you can drill down to see subcategories of each topic, or you can filter the Dashboard by specific sentiment score.
-
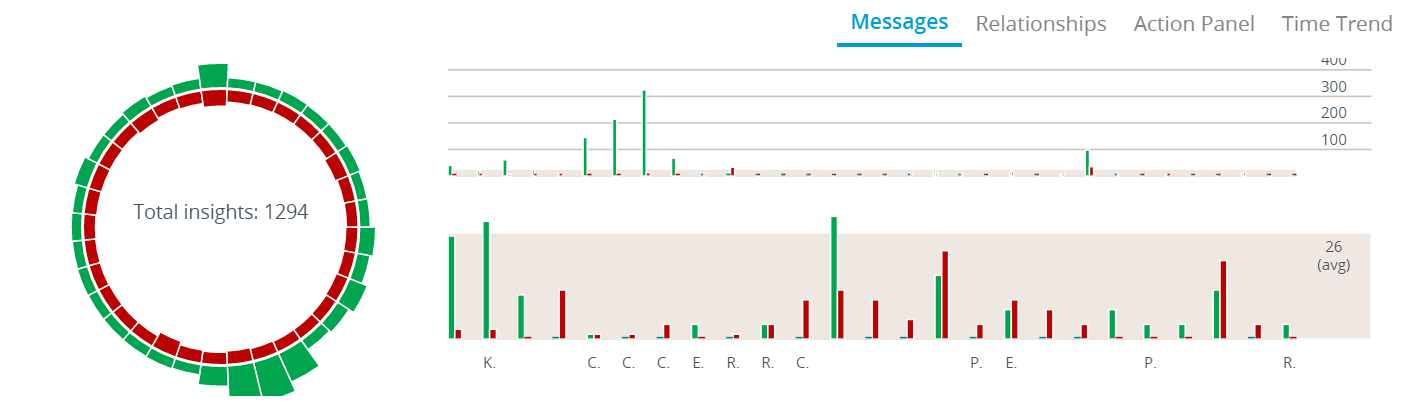
Right-click and click Open in full view to see an expanded version of the widget in the Main panel of the Dashboard.
Tip: Click a segment to filter the Dashboard by the sentiment and topic it represents; for example, click the green segment next to "Product" to only see positive feedback related to your product on the Dashboard.